Long-Term Track Record of Outperformance and Cash Generation:
- Revenue and adjusted operating profit CAGR of +7.1% and +12.4% between FY20 and FY25
- Strong cash conversion delivery
- $12B returned to shareholders over the past 10 years

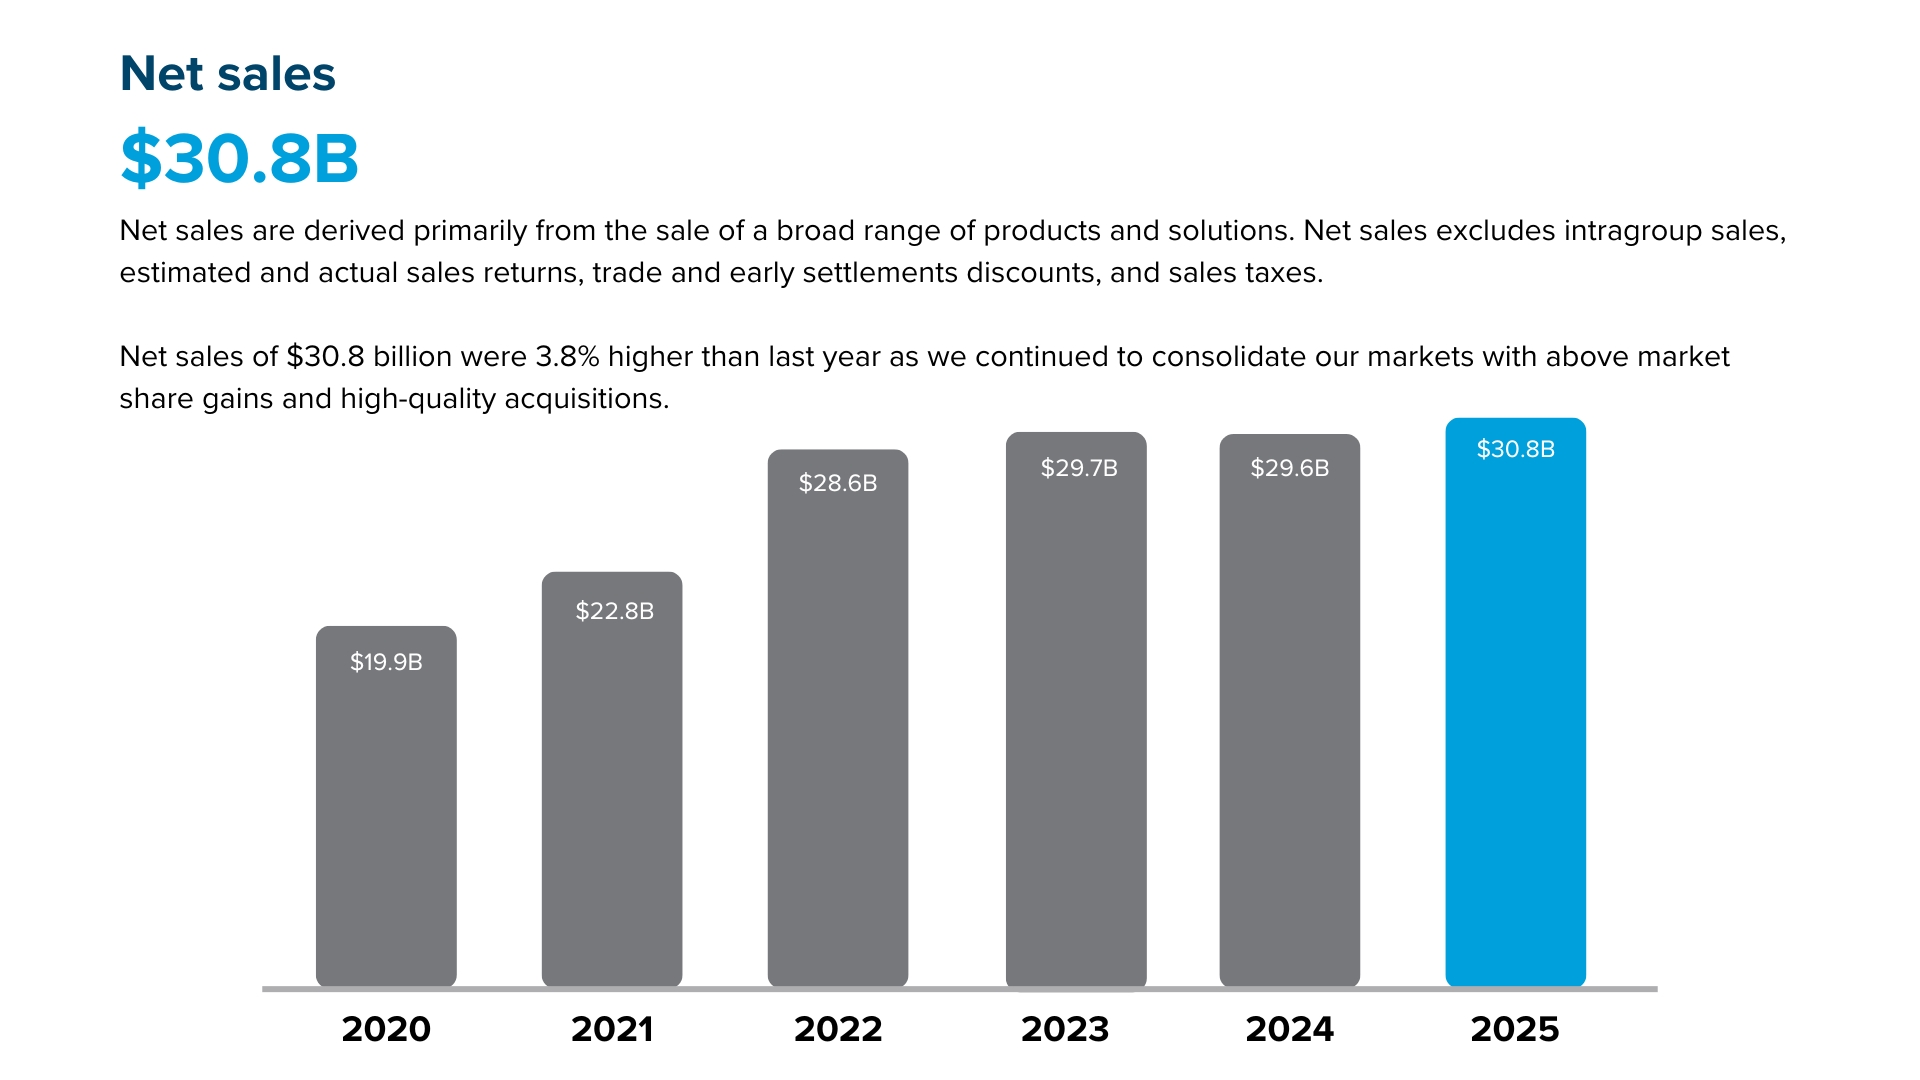
Net Sales
Net sales are derived primarily from the sale of a broad range of products and solutions. Net sales excludes intercompany sales, estimated and actual sales returns, trade and early settlement discounts, and sales taxes.
Net sales between 2020 and 2025:
- 2020: $19.9 billion
- 2021: $22.8 billion
- 2022: $28.6 billion
- 2023: $29.7 billion
- 2024: $29.6 billion
- 2025: $30.8 billion
In 2025, net sales were 3.8% ahead of last year.

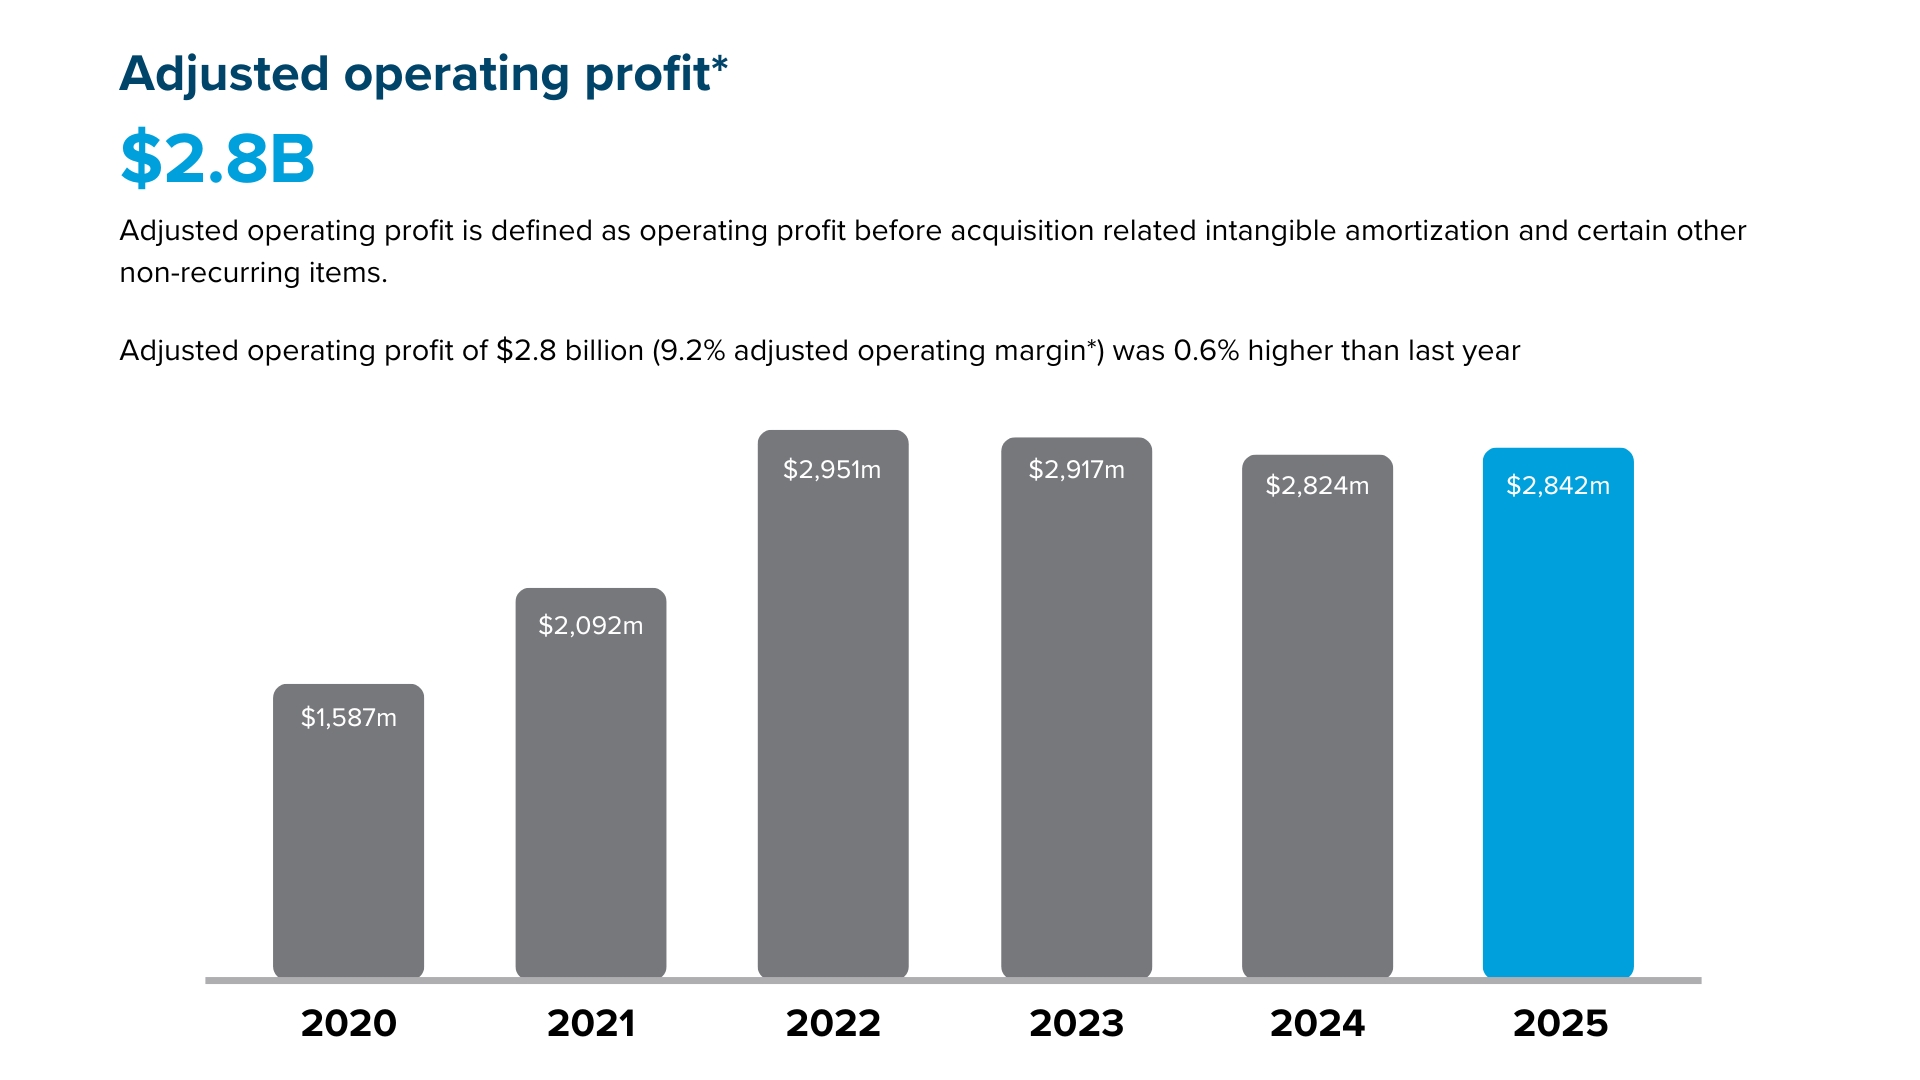
Adjusted Operating Profit*
Adjusted operating profit is defined as operating profit beforeacquisition related intangible amortization and certain other non-recurring items.
Adjusted operating profit between 2020 and 2025:
- 2020: $1,587 million
- 2021: $2,092 million
- 2022: $2,951 million
- 2023: $2,917 million
- 2024: $2,824 million
- 2025: $2,842 million
In 2025, adjusted operating profit was 0.6% higher than last year.
*This is a non-GAAP measure. See the appendix of FY2025 Q4 presentation for more information and a reconciliation of the non-GAAP measure to the most comparable U.S. GAAP measure.
Adjusted operating margin is calculated as adjusted operating profit divided by net sales.